Correction levels and Fibonacci grid: what is trading and how to use it
Ralph Nelson Elliott, an American financier, noticed certain relationships in the behavior of stock price charts. Having traced them, it can be noted that they also strive to achieve the golden ratio. All the trader’s tools used in carrying out work on the stock exchange, in which the Fibonacci numerical series is used, are named after him. These include: arcs, fans, time zones. But the main and most common version of the tool is correction levels.
A little bit about Fibonacci and the golden ratio
In 1170, the legendary Italian mathematician Leonardo Pisano was born, who went down in history under the pseudonym Fibonacci. Centuries later, he is remembered as the man who discovered the principle of the golden ratio. The number of the golden section is 1.618 (the arithmetic quotient of neighboring numbers of the same sequence). This is how the numerical indicator was called because everything in nature strives to achieve this number. For example, the structure of a snowflake, a flower, a cell of cones, pineapples. Examples can be continued indefinitely. This is the number of harmony in nature. Even the structure of the human body has proportions close to the number of the golden ratio.
The numerical sequence of the Italian begins with the numbers 0 and 1, and then the infinite series continues from the sum of the previous two:
0, 1, 1, 2, 3, 5, 8, 13, 21, 34, 55, 89, 144, 233…
When the first number of the sequence is divided by the second, the real magic of numbers happens. The number 0.618 is always obtained. If you skip one of the numbers in the smaller direction – 0.382. To date, the secrets of the sequence torment the minds of mathematicians and mystics, esotericists and lovers of secret knowledge.
Fibonacci Grid
This is a tool used by specialists when working on the Forex market. It is present in almost all oscillators. The chart that the trader observes has a direction of development in time from the initial value of the lot value. In the process of changing market conditions, take profit 1, take profit 2, take profit 3 indicators change their location. The graph also defines entry points and exit points.
In fact, the trader sees which price indicators appeared most often and uses the information obtained to perform an analysis of market activity for the sale and purchase of assets in the market.
The Fibonacci grid is applicable for understanding the time of opening trades and placing “stops”. The grid uses so-called “swings” to display key indicators. These are grid candlesticks, on both sides of which there are at least two indicators maximum and minimum.
Correction levels
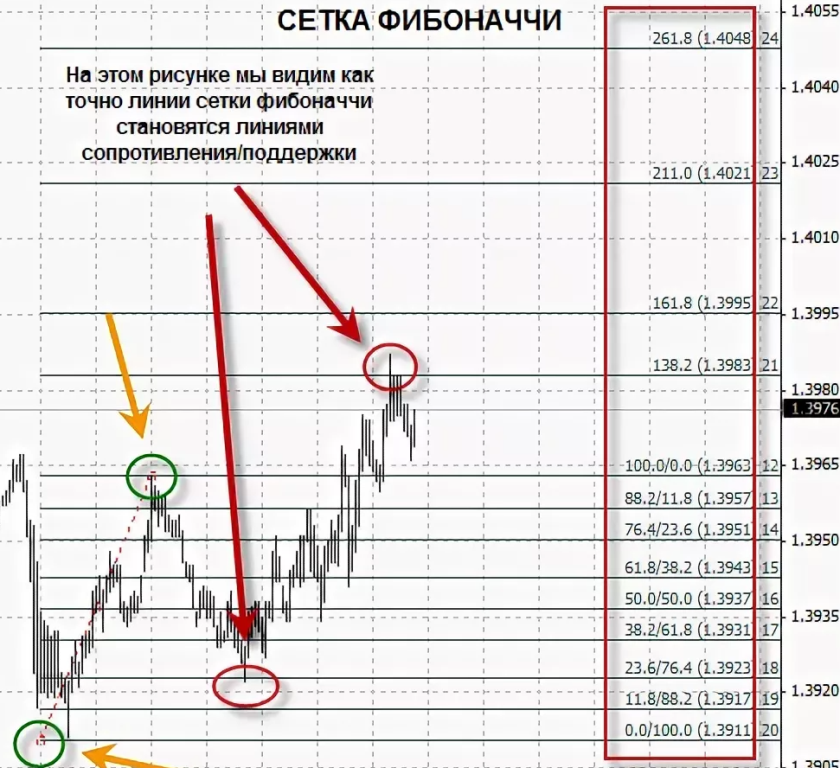
In professional trend terminology, correction levels are called “retracement”. This is an appropriate tool, and they are not suitable for consolidation. If the trend tends to rise upwards, the price on the contrary will tend to pull back from the resistance level. In the downward direction, the situation will be reversed.
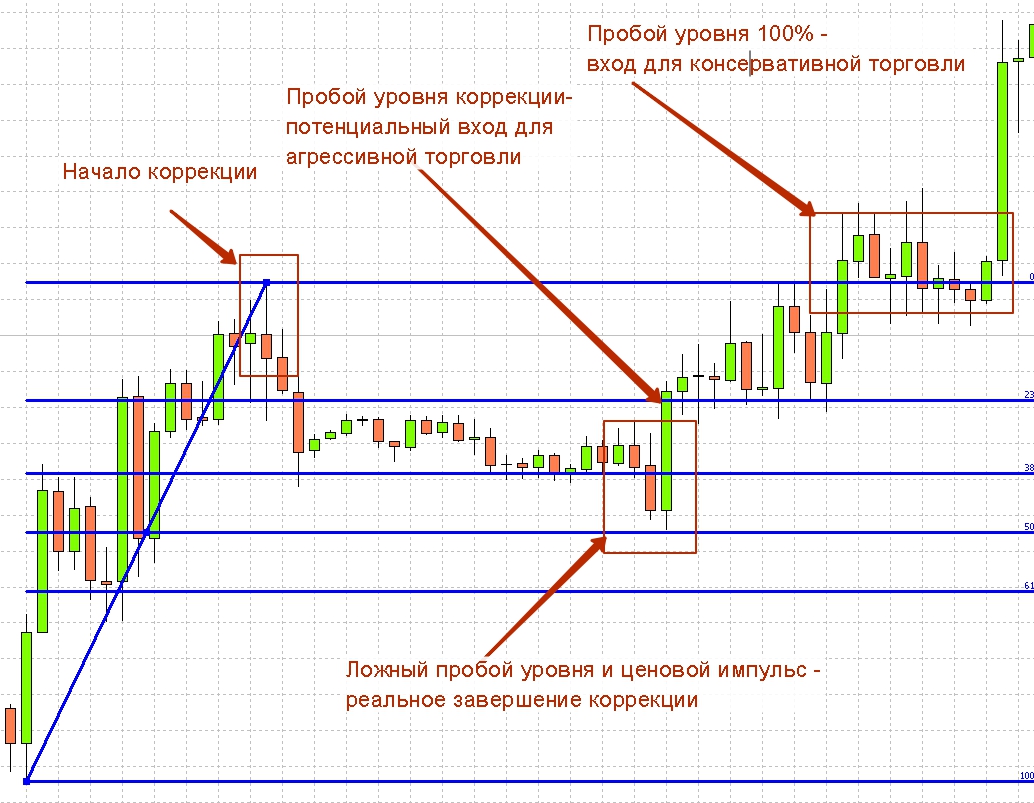
To build correction levels, the trader must determine the lower and upper swings on the oscillator chart. Use the toolbar to select the Fibonacci grid and stretch it between the marked swings.
The tool will automatically show the retracement levels. The data shown does not guarantee the mandatory success of work on the stock exchange, but it will greatly simplify life by displaying the likely moment of a rebound or rollback.
Conclusions
Fibonacci retracement levels are a part of technical analysis when working on the international stock exchange Forex. Constant filtering of data is required from the bidder, since all elements of technical analysis are based on the construction of probabilities. There are no guarantees that the value of the trend will behave in accordance with the requirements of the chart.
In this regard, experts recommend working together with support/resistance levels and trend lines. You can also use other tools that are embedded in a market participant’s favorite oscillator. It is not necessary to use all of them, it is enough to choose those that allow a particular user to receive the maximum amount of reliable and timely information support to improve the quality of their work within the stock exchange. These are the basics of technical analysis.or rollback.
Published: 23 January, 2022